Most CPG brands think they know their profit margins, but hidden costs are quietly eroding their bottom line by an average of 15-20%. True profitability analysis goes far beyond basic cost-of-goods calculations to reveal the real financial health of your product lines.

The Hidden Complexity of CPG Profit Margins
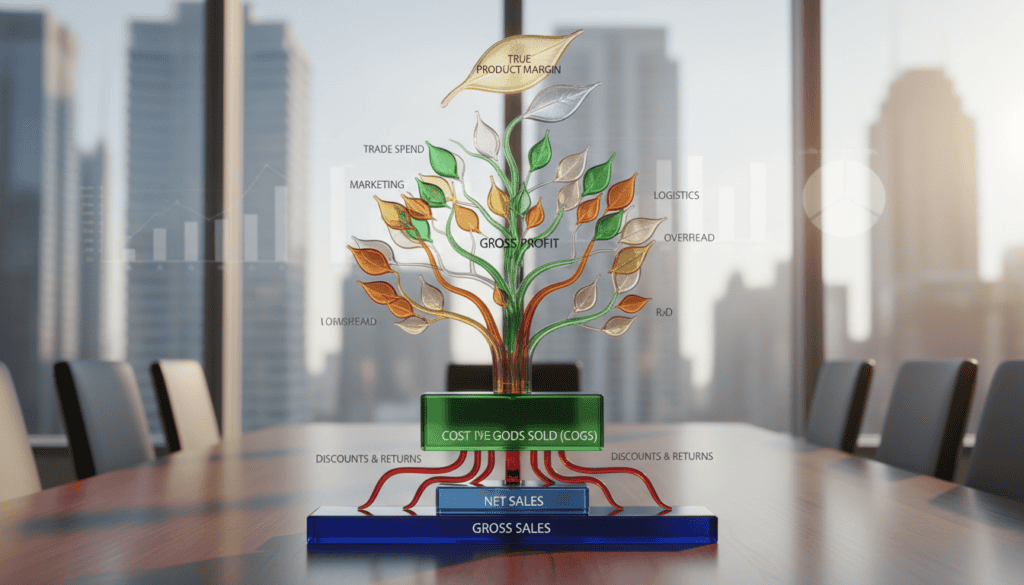
Consumer packaged goods profitability isn’t just about manufacturing costs versus selling price. The reality is much more nuanced. Every successful CPG brand needs to account for dozens of cost factors that can make the difference between a thriving product line and one that’s secretly bleeding money.
Here’s what makes CPG profitability analysis particularly challenging: your costs are constantly shifting. Raw material prices fluctuate, shipping rates change, promotional spending varies by season, and retailer fees evolve. Without a complete understanding of these moving parts, you’re flying blind.
Why Traditional Margin Calculations Fall Short
Most businesses calculate gross margin using this simple formula: (Revenue – Cost of Goods Sold) / Revenue. But this approach misses critical elements that can dramatically impact your true profitability:
- Trade promotion costs and retailer allowances
- Distribution and logistics expenses
- Marketing and advertising spend
- Slotting fees and category management costs
- Returns, damages, and unsalable inventory
- Seasonal demand fluctuations
Building a Complete CPG Profitability Framework
To understand your true product margins, you need a systematic approach that captures all cost elements. Here’s how to build a framework that gives you accurate, actionable insights.
Step 1: Map Your Complete Cost Structure
Start by identifying every cost that touches your product from conception to consumer purchase. This might surprise you, but most CPG brands underestimate their true costs by 10-30%.
Direct Product Costs:
- Raw materials and ingredients
- Packaging materials
- Manufacturing labor
- Quality control and testing
- Co-packer fees (if applicable)
Distribution and Logistics:
- Warehousing and storage
- Transportation to distributors/retailers
- Third-party logistics fees
- Inventory carrying costs
- Damage and shrinkage
Trade and Marketing Expenses:
- Trade promotions and discounts
- Slotting fees and promotional allowances
- Advertising and marketing campaigns
- In-store marketing materials
- Broker commissions
Step 2: Allocate Costs Accurately by Product Line
Here’s where many CPG brands get tripped up. They know their total costs, but they don’t allocate them properly across different products, sizes, or channels. A 12-pack of your product might seem more profitable than individual units, but when you factor in the specialized packaging, different distribution requirements, and unique promotional costs, the numbers might tell a different story.
Use activity-based costing to assign expenses based on what actually drives costs, not just simple volume splits. This approach reveals which products, package sizes, and sales channels are your real profit drivers.

Advanced Margin Analysis Techniques
Contribution Margin by Channel
Different sales channels have dramatically different cost structures. Selling to Walmart involves different trade terms, logistics requirements, and support costs compared to selling through specialty food distributors or direct-to-consumer channels.
Calculate contribution margins for each major channel:
- Mass retail (grocery chains, big box stores)
- Specialty retail
- Food service
- E-commerce platforms
- Direct-to-consumer
This analysis often reveals surprising insights. You might discover that your smallest volume channel is actually your most profitable, or that a major retail relationship is destroying your margins despite high sales volume.
Seasonal Profitability Patterns
CPG profitability fluctuates throughout the year based on demand patterns, promotional calendars, and supply chain dynamics. Map your margins by quarter or month to identify:
- Peak profitability periods
- Seasonal cost spikes (raw materials, transportation)
- Heavy promotional periods that compress margins
- Inventory buildup costs before peak seasons
Product Portfolio Optimization
Once you have accurate margin data, you can make strategic decisions about your product portfolio. This doesn’t always mean cutting low-margin products – sometimes they serve as traffic drivers or complement high-margin items.
Consider these portfolio strategies:
- Margin Enhancement: Reformulate or repackage low-margin products
- Strategic Pruning: Discontinue products that drain resources
- Channel Optimization: Shift products to more profitable sales channels
- Innovation Focus: Develop new products in high-margin categories
Tools and Systems for Ongoing Analysis
Data Integration Requirements
Effective CPG profitability analysis requires pulling data from multiple sources:
- ERP systems for manufacturing and operational costs
- Trade promotion management platforms
- Retailer data feeds (EDI, syndicated data)
- Marketing spend tracking systems
- Logistics and distribution cost data
The key is creating automated data flows so you can track margins in real-time, not just during quarterly reviews.
Key Performance Indicators to Monitor
Track these metrics consistently across your product portfolio:
- Gross Margin: Basic profitability after direct costs
- Trade-Adjusted Margin: Gross margin minus trade promotions
- Contribution Margin: After all variable costs
- Net Margin: After allocated fixed costs
- Margin Velocity: Profit dollars per day of inventory

Common Profitability Pitfalls to Avoid
The “Revenue Growth at Any Cost” Trap
Many CPG brands focus so heavily on top-line growth that they sacrifice profitability. This often happens when brands accept unprofitable promotional terms to gain distribution or volume. Always calculate the true cost of growth initiatives.
Ignoring Opportunity Costs
Manufacturing capacity, working capital, and management attention are limited resources. A product line that breaks even financially might still be unprofitable if those resources could generate better returns elsewhere.
Static Cost Assumptions
Your cost structure changes constantly. Set up quarterly reviews to update your profitability models with current costs, especially for volatile inputs like commodities, transportation, and promotional spending.
Turning Analysis into Action
Pricing Strategy Optimization
With accurate margin data, you can make informed pricing decisions. This might mean raising prices on high-demand products, offering strategic discounts to move slow-turning inventory, or restructuring trade terms with retailers.
Cost Reduction Initiatives
Focus cost reduction efforts where they’ll have the biggest impact. If packaging represents 15% of your product cost but promotional allowances are 25%, which deserves more attention?
Resource Allocation Decisions
Direct your marketing spend, innovation resources, and sales efforts toward your most profitable products and channels. This doesn’t mean abandoning everything else, but it ensures you’re maximizing returns on your investments.
Conclusion
Understanding true CPG profitability requires looking beyond simple cost accounting to capture the complete picture of what drives margins in your business. The brands that invest in sophisticated profitability analysis gain a significant competitive advantage – they know which products, channels, and strategies actually generate profits.
The complexity of modern CPG operations means this analysis requires both analytical rigor and strategic thinking. You need systems that can handle large volumes of data from multiple sources, but you also need the business insight to interpret that data and act on it effectively.
At Beast Creative Agency, we help CPG brands build marketing strategies that enhance profitability, not just drive volume. Our AI-enhanced campaigns and radical transparency approach ensure your marketing investments support your most profitable products and channels. Ready to turn your profitability insights into growth? Let’s talk about how our certified specialists can help optimize your marketing ROI.